The $56M discovery
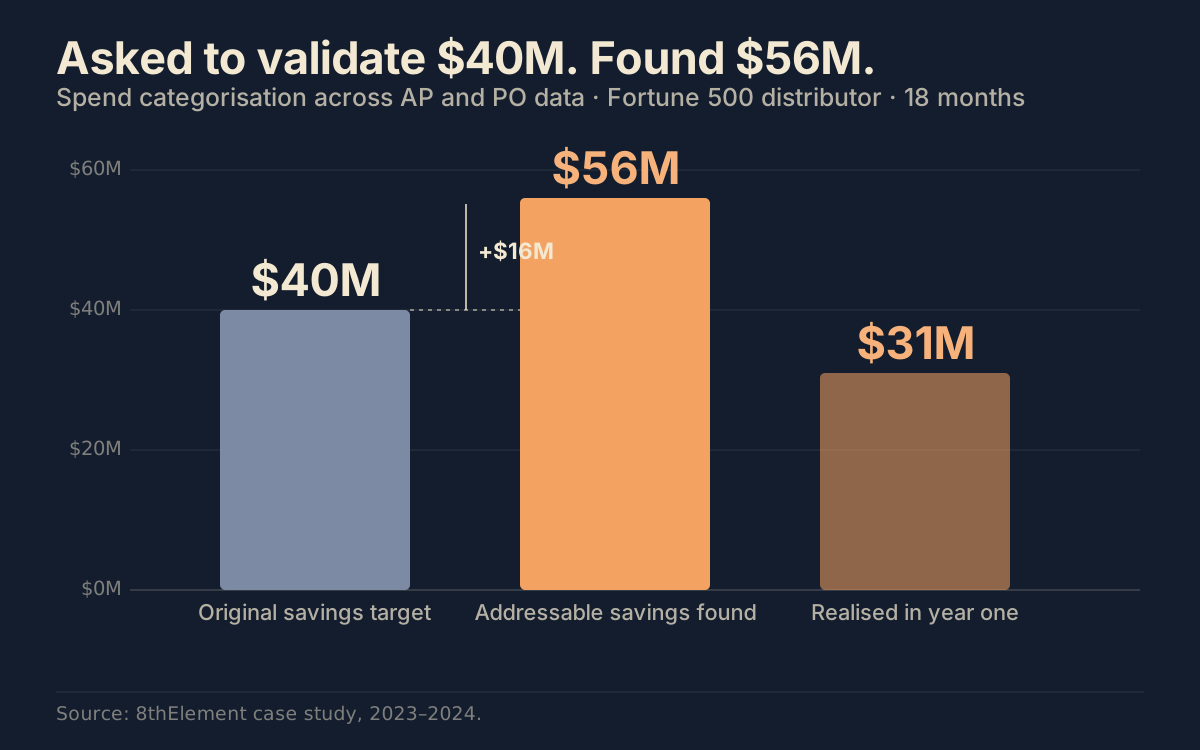
A Fortune 500 wholesale and distribution group asked us to validate a $40M savings target. We found $56M in the same data, and $31M was realised in year one.
Fortune 500 distributor · 18 months
A savings target nobody was sure about.
Procurement had set a $40M target. Finance wanted to know if it was real. The data existed — years of AP and PO lines across hundreds of suppliers — but had never been categorised consistently enough to answer the question. Manual categorisation had been tried and abandoned.
Categorise everything, normalise every vendor, then look.
The Spend Categoriser classified every line to a taxonomy, normalised vendor names across entities and regions, and surfaced consolidation, contract-compliance and price-variance opportunities with a confidence score and the baseline behind each.
Patterns invisible at line level.
The same supplier appearing under six names, off-contract buying in categories with a negotiated rate, and price variance across regions for identical items. Category managers validated the opportunities and ran the negotiations.
Four things worth carrying forward.
Validate targets with data, not confidence
The target was reasonable. The data said it was conservative.
Vendor normalisation is where the money hides
One supplier under six names is invisible to manual review and obvious to a model.
Realisation is a human job
Finding $56M was the agent's work. Realising $31M was the category managers'.
Make it monthly
A one-off categorisation is a report. A monthly one is a control.